

Following on the first part (see here) where the origins of chemotherapy were briefly discussed, I am here today to present the numbers available on the web and that concern survival rates to cancer. This topic is far from being of a simplistic nature; the disease itself is complicated, multifaceted and generates eruptive emotions. But times have been changing with developments made known that bring new pharmaceuticals to hospitals, better knowledge on disease development and more sensitive predictive technology. Available literature on the matter of survival to cancer is not scarce at all, having said that it is difficult to summarise the enormous lists of sources, references and cited researches that populate the Internet these days.
To better present data in a simplified manner, I decided to generate a summary table where you can find the different categories and the sources used to populate it. Bear in mind that, as expected, this is not an exhaustive compilation of data, but a rough approach to some of the most relevant articles I was able to find with the very limited time I have available these days. I hope that this table can, at least, lead you to the very fine research that is being developed by some important research groups worldwide. Apologies if most of these results are retrospective, but as one can imagine the time it takes for these groups to compile genuine data and make sense of the gathered numbers, discuss these and reproduce meaningful information in the shape of reliable publications, is on its own self-explanatory.
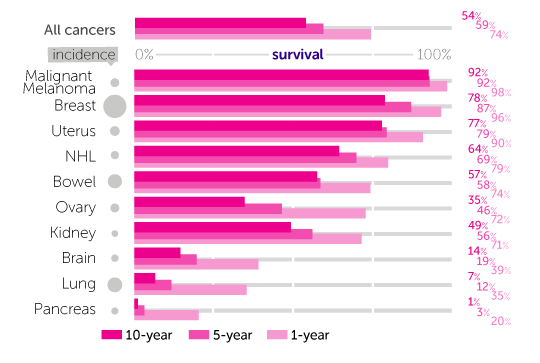
Finally, it would be simpler to just copy-paste incredibly well-put information obtained from websites such as the Cancer Research UK (access here) where a comprehensive and extraordinarily well structured summary of cancer survival rates (for most common cancers) is presented concerning the regions of England and Wales. However, this pool of information comes with many limitations, the first one being the fact that not all countries are represented, and the disease specificity as well as the medical techniques involved are not so well described.
 [A]
[A]
So to overcome this over generalisation that can be informative to a certain extent, but may lack on a certain identity, I decided to approach this article with a live-table. This table is not amorphous or rigid but a 'tool' that I will be updating whenever I find specific articles that due to their inherent quality and development of a particular treatment analysis represent, in my humble opinion, a good retrospective-or-present indicator of the survival rates associated to a certain population/technique/cancer type/methodology. In addition, this is a nicer method to assess how survival rates have changed through time with the improvements on methodology and technology. And click on the images for better resolution!!!
Please consider this article in constant progression:

[1] Young, J, L., Ries, L. G., Silverberg, E. et al (1986). "Cancer Incidence, Survival and Mortality for Children Younger than Age 15 Years old". Cancer, 58, pp. 598-602.
[2] Lai, E. C., Tompkins, R. K., Mann, L. L., Roslyn, J. J. (1987). "Proximal Bile Duct Cancer. Quality of Survival". Annals of Surgery, 205(2), pp. 111-118.
[3] Folkesson, J., Birgisson, H., Pahlman, L. et al (2005). "Swedish Rectal Cancer Trial: Long lasting benefits from radiotherapy on survival and local recurrence rate". Journal of Clinical Oncology, 23(24), pp. 5644-5650.
[A] Images kindly taken from Cancer Research UK, Cancer survival for common cancers, [http://www.cancerresearchuk.org/health-professional/cancer-statistics/survival/common-cancers-compared#heading-Two], last visited on the 6th of June 2018, last update unknown.
No comments:
Post a Comment